
Learning module:
Migration experiences Defining Moments, 1945–present
Investigation 1: What have been the ‘waves’ of migration?
1.1 Who has come to Australia since 1945?
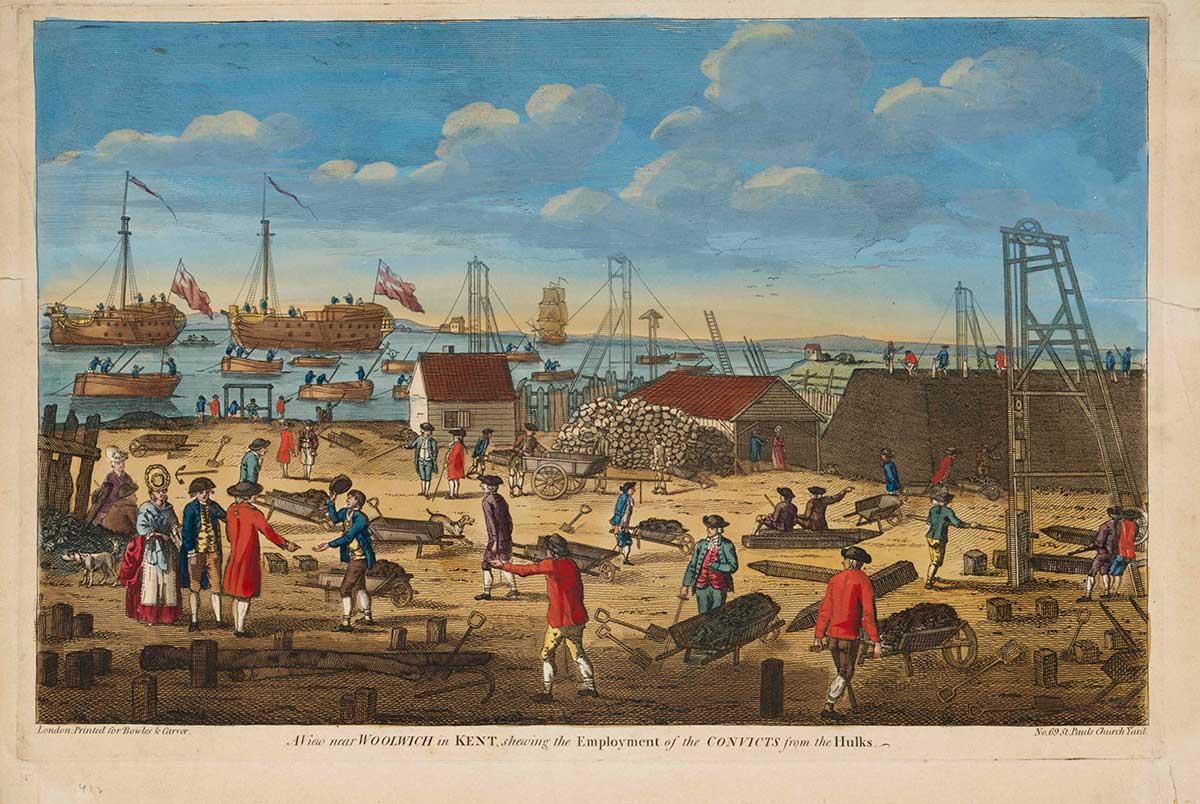
You have seen from the Background information that migration has been important for Australia since 1788. Migrants came from a number of different countries, but the largest number by far came from Britain.
This graph of Australia’s population born overseas shows that the postwar period you are studying is significant.
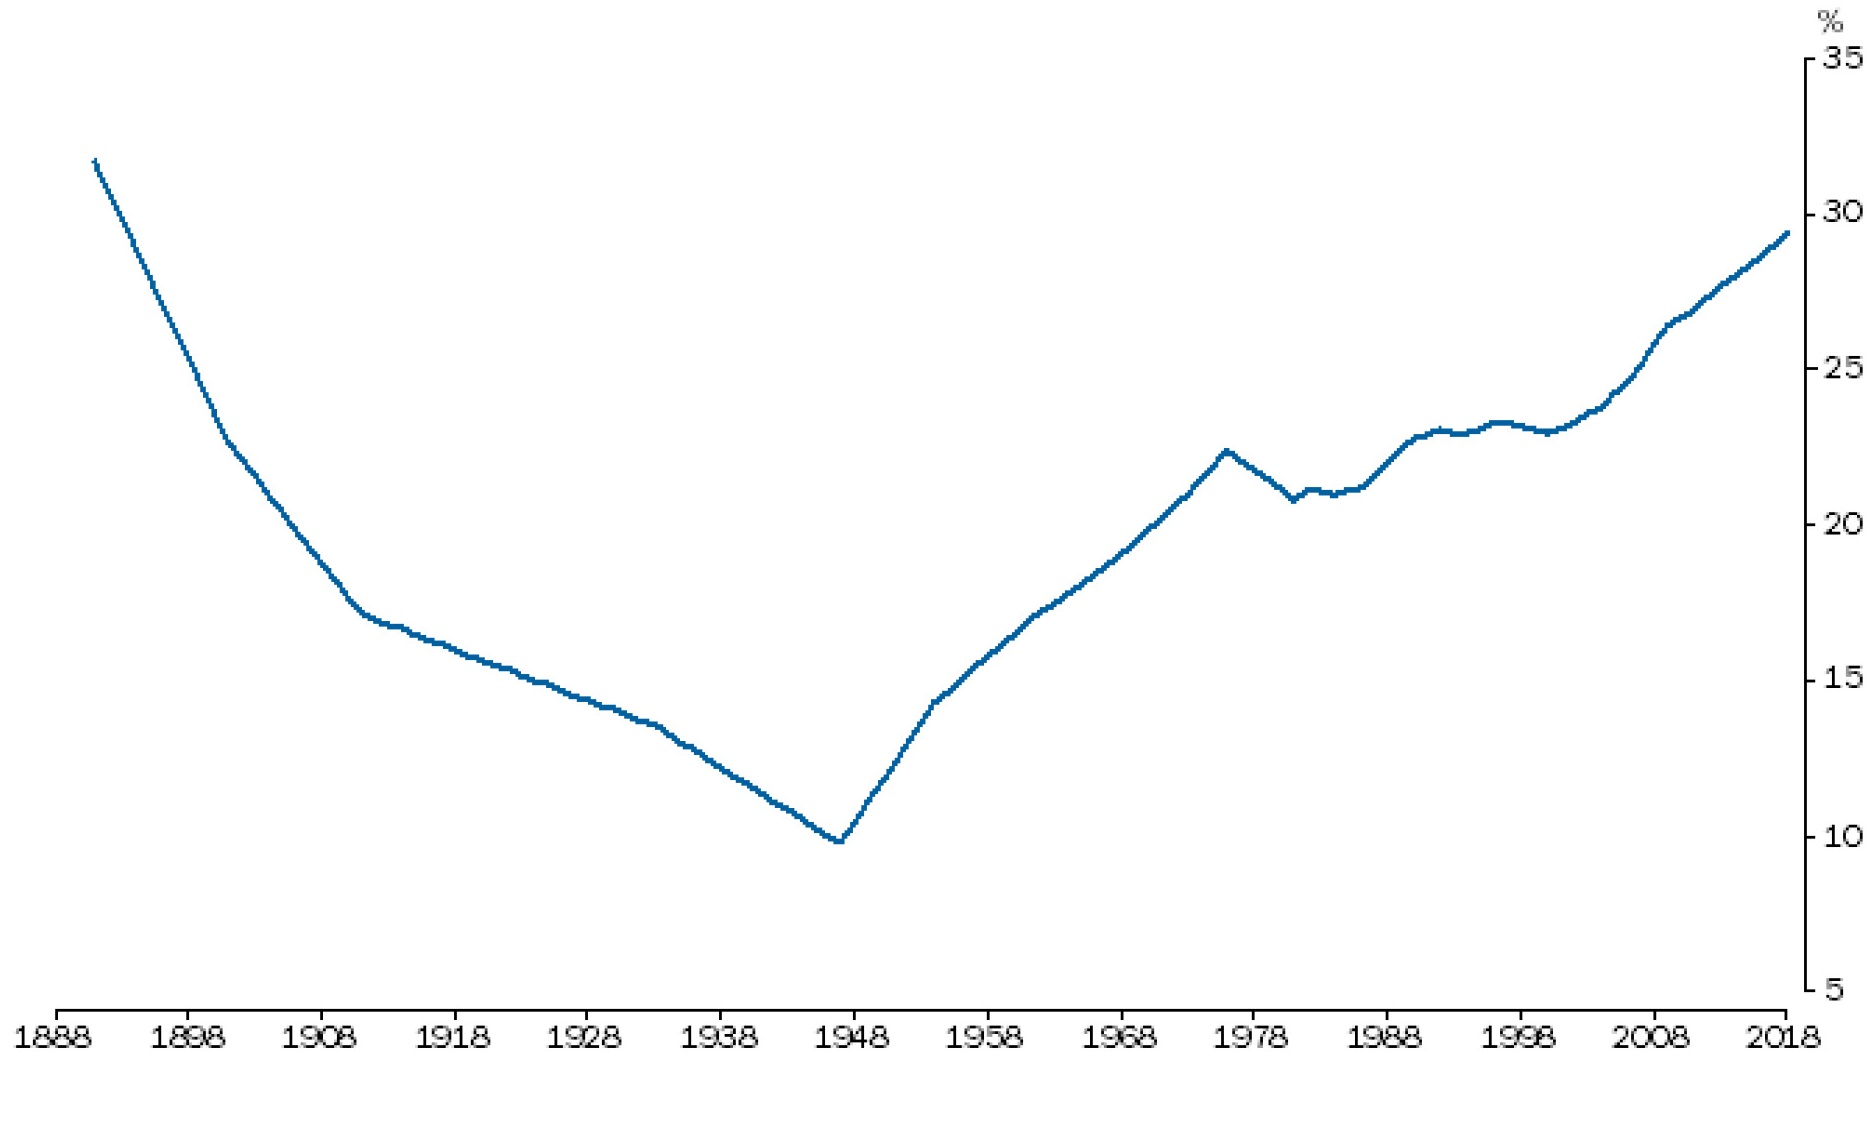
ABS, CC BY 4.0, https://bit.ly/3cvgGZR
1. Dividing the graph into thirds, which of these is the most accurate general description of the trend:
2. As of 2018, about what percentage of the Australian population was born in another country?
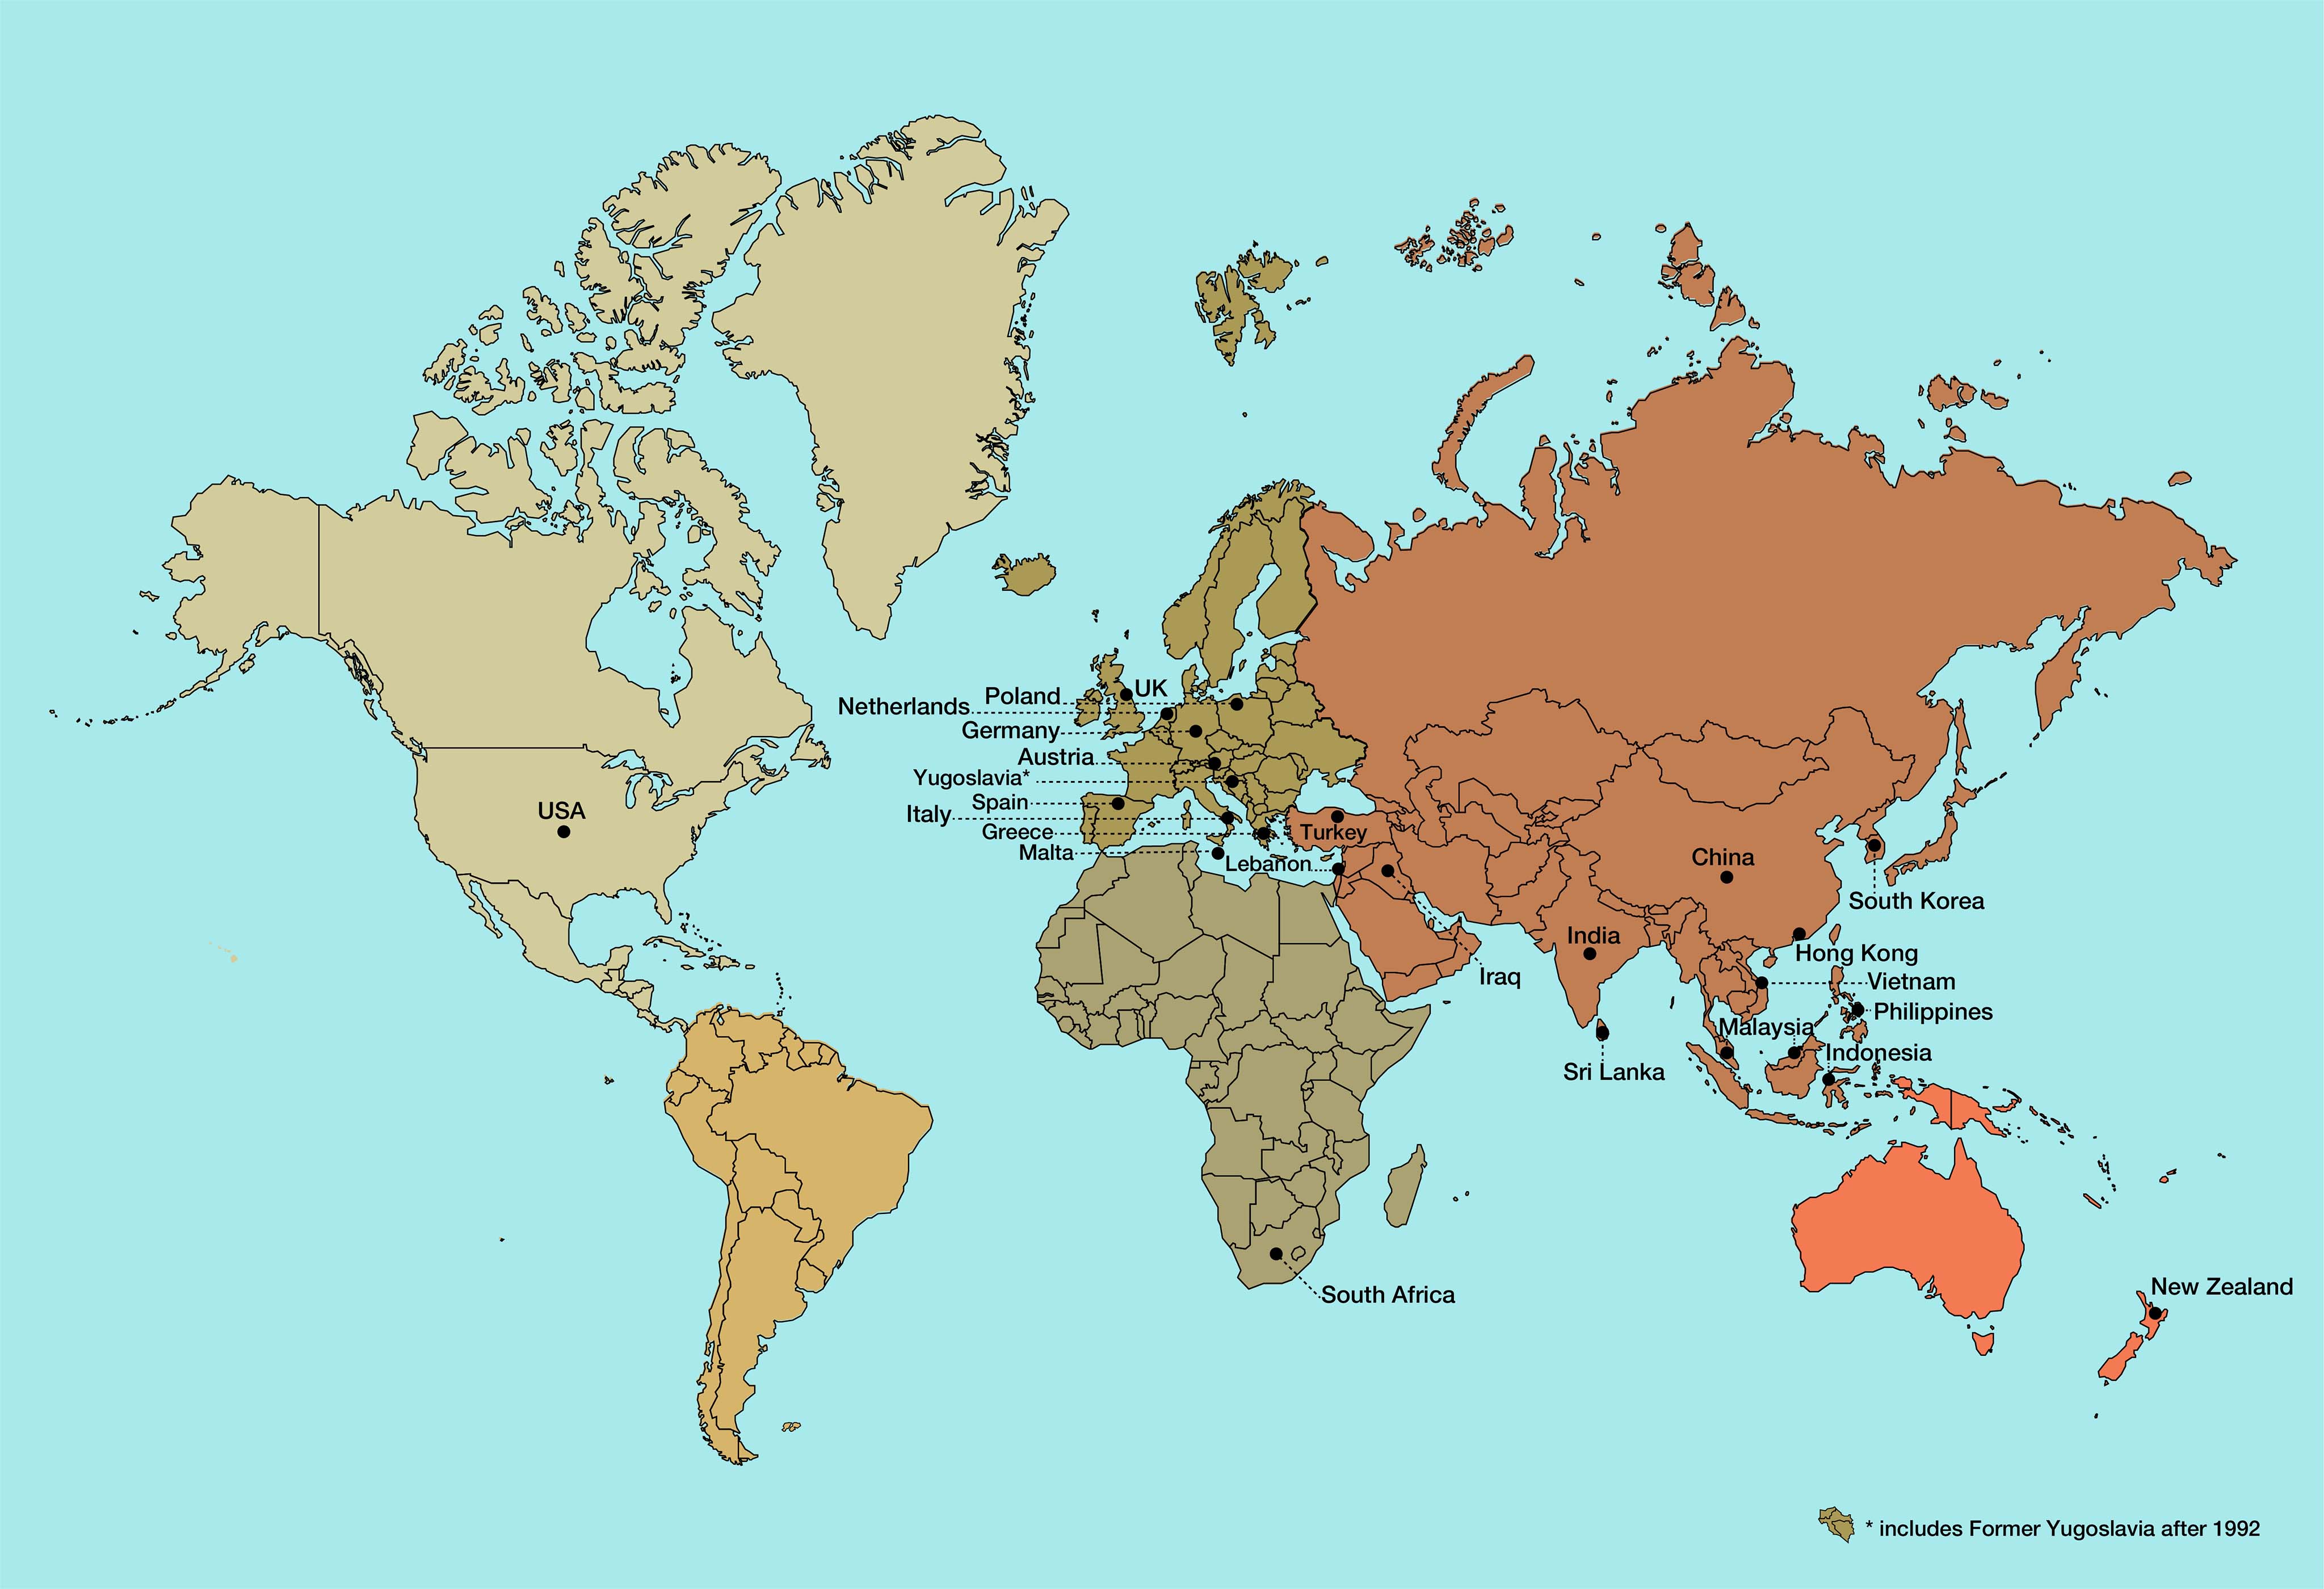
This map of the world shows which countries have been major providers of migrants to Australia since 1945. Use the map as a visual reference as you work through the migration to Australia table below.

Eliane Touma
The following table shows the total numbers of migrants from each of the countries on the map, per decade, since the end of the Second World War. It also shows the rank of each country as a major provider of migrants to Australia for each period.
| Country | 1945–1956/57 | 1957/58–1966/67 | 1967/68–1976/77 | 1977/78–1986/87 | 1987/88–1996/97 | 1997/98–2006/07 | 2007/08–2016/17 | |
|---|---|---|---|---|---|---|---|---|
| Austria | 8th 29774 |
|||||||
| China | 7th 17865 |
6th 47499 |
3rd 123053 |
2nd 266250 |
||||
| Germany | 2nd 180631 |
4th 52393 |
8th 25056 |
|||||
| Greece | 5th 47152 |
3rd 104602 |
4th 59081 |
|||||
| Hong Kong | 4th 70126 |
|||||||
| India | 9th 12946 |
9th 24567 |
7th 36726 |
4th 93820 |
1st 306768 |
|||
| Indonesia | 7th 38861 |
|||||||
| Iraq | 10th 38178 |
|||||||
| Italy | 3rd 177236 |
2nd 143883 |
3rd 63317 |
|||||
| Lebanon | 6th 35552 |
9th 16359 |
||||||
| Malaysia | 6th 21876 |
8th 35530 |
8th 33747 |
7th 49914 |
||||
| Malta | 6th 36829 |
7th 27872 |
||||||
| Netherlands | 4th 87599 |
6th 43542 |
||||||
| New Zealand | 7th 31772 |
8th 21689 |
5th 42767 |
2nd 109626 |
2nd 120639 |
2nd 183250 |
4th 220567 |
|
| Philippines | 4th 30082 |
5th 56812 |
6th 44300 |
5th 109985 |
||||
| Poland | 10th 9568 |
9th 13476 |
||||||
| South Africa | 5th 27956 |
5th 64184 |
6th 71378 |
|||||
| South Korea | 10th 24581 |
|||||||
| Spain | 10th 12698 |
|||||||
| Sri Lanka | 10th 23200 |
9th 45885 |
||||||
| Turkey | 10th 22330 |
|||||||
| UK | 1st 425234 |
1st 518853 |
1st 496853 |
1st 185512 |
1st 160502 |
1st 188832 |
3rd 237700 |
|
| USA | 7th 33331 |
10th 15451 |
||||||
| Vietnam | 3rd 92906 |
3rd 70963 |
9th 26917 |
8th 47926 |
||||
| Yugoslavia** | 5th 50787 |
2nd 104410 |
8th 16436 |
9th 33556 |
||||
**includes Former Yugoslavia after 1992
Australian Government, Historical Migration Statistics, https://data.gov.au/data/dataset/historical-migration-statistic
3. Look at each column in the table to see how the different countries ranked as a source of migration to Australia in each of the periods.
**includes Former Yugoslavia after 1992
4. Which part of the world are these countries located in?
**includes Former Yugoslavia after 1992
6. Which part of the world are these countries located in?
**includes Former Yugoslavia after 1992
8. Now complete these statements about the key features of the ‘waves of migration’ to Australia:
(A) Before 1945 the main source of migration to Australia was:
(B) Immediately after the Second World War Australia started looking for migrants from:
(C) From the 1970s, Australia increasingly looked for its migrants from:
9. What do these migration figures tell us about the development of Australia’s migration policy after the Second World War?
10. Was this a major change of government policy? Give reasons for your answer.
A research activity: Several countries have provided large numbers of migrants in only one decade. Others do not appear in the list because immigration from their country was for a short time only, so they do not appear for that decade. Some of these heavy but brief providers are: Chile, Spain, Turkey, Iraq, Iran, Thailand, Cambodia, Bangladesh, and Nepal. Research to discover what events occurred to create this intense but short-lived migration from these countries.
Look back at the Key Questions. Which of these questions do you think you can now answer fully? Which need more research?
You have now identified waves or changes in immigration to Australia in the postwar period. You need to explore further to investigate why those changes occurred, and what impacts this had on Australia.